How to Use DC Chargers for Fleet Energy Management

Time:2026-10-28 Author:Madeline
0%

Managing a commercial EV fleet requires more than installing chargers and plugging vehicles in overnight. Depot managers must coordinate vehicle schedules, battery state of charge, route requirements, charger capacity, and electricity costs. A delivery van leaving at 6:00 a.m. may need a higher charging priority than a vehicle returning later. Small timing decisions can affect operational reliability.

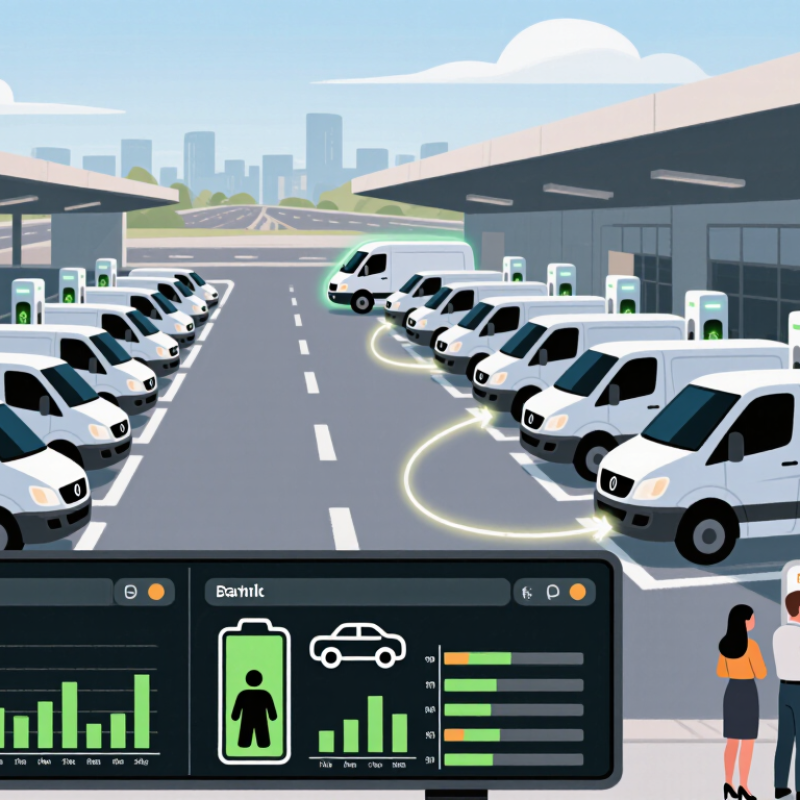
How DC chargers help with fleet energy management becomes clearer when charging data connects with daily fleet operations. DC chargers can restore useful range quickly during short breaks, shift changes, or urgent route adjustments. Their software can also monitor charging power, session duration, battery status, and energy consumption. Managers can use this information to reduce unnecessary peak demand and identify vehicles with unusual charging behavior. A depot with ten vehicles might stagger charging sessions instead of powering every charger at full output simultaneously.

The process is not perfect. Energy prices change, routes are often unpredictable, and charging systems may not communicate smoothly with fleet software. That is why managers should test charging policies in a real depot before expanding them. A practical pilot can compare electricity costs, vehicle readiness, charging queues, and driver feedback. These results provide stronger evidence than assumptions or advertised performance figures. Experienced teams also review cable safety, equipment maintenance, weather conditions, and manufacturer guidance. DC charging can support faster operations, but it does not replace careful planning. The best system balances speed, battery health, grid limits, and business needs. Mistakes will happen. Continuous review makes them useful.
How to Use DC Chargers for Fleet Energy Management

Measure Fleet Duty Cycles Against 50–350 kW DC Charger Ratings (DOE)

Fleet energy management starts with measuring duty cycles, not guessing from charger nameplates. A 50–350 kW DC charger shows maximum output, not guaranteed delivery. Record each vehicle’s arrival time, departure time, battery state of charge, energy added, and peak power. Then compare those results with route demand and available dwell time.

Tips: Build a 14-day charging log. Separate morning, midday, and overnight sessions. A 150 kW unit may deliver less power as the battery fills or temperatures change. For example, a vehicle needing 180 kWh during a 45-minute stop may require more than a 250 kW rating suggests. Keep spare capacity for cold weather, queue changes, and unexpected routes. Measure real sessions.

Use a DOE-informed duty-cycle review to match charger ratings with operational patterns. If vehicles return with low state of charge and leave within 30 minutes, higher-power equipment may reduce scheduling risk. If vehicles remain parked for several hours, several 50–100 kW chargers may provide better utilization and lower site demand. Review peak demand charges, transformer limits, and simultaneous charging. A spreadsheet can reveal that the largest charger is rarely necessary. That finding may be uncomfortable, but it is useful. Recheck the model each season, because routes, payloads, driver behavior, and battery performance change.

Forecast Energy Demand Using the IEA’s 14 Million EV Sales in 2023

How to Use DC Chargers for Fleet Energy Management

The IEA recorded nearly 14 million electric car sales worldwide in 2023. That figure signals faster charging demand ahead. Fleet operators can use it as a market baseline, not a direct fleet forecast.

A practical forecast starts with route data. Record vehicle count, daily mileage, battery size, arrival time, and state of charge.

For example, 40 vans using 65 kWh each at 70% daily depletion need about 1,820 kWh. Add charging losses and a modest reserve. The site may require roughly 2,000 kWh overnight.

DC chargers can deliver this energy quickly, but uncontrolled charging may create expensive demand peaks.

Measure every session.

Use charger records with telematics data. Compare predicted energy with actual consumption each week. The IEA’s Global EV Outlook provides credible market context, yet regional sales patterns can differ sharply. A city fleet may grow faster than national adoption, while another may electrify slowly.

My first forecast looked precise. It was not. I ignored winter heating, traffic delays, and vehicles returning late. A better model uses three scenarios: normal operations, high-mileage days, and delayed charging. Set charging priorities around departure times, battery limits, and available grid capacity. Review those settings after real operating weeks, because driver behavior often defeats a clean spreadsheet.

Schedule DC Charging to Reduce Peak Loads and Demand Charges (NREL)

How to Use DC Chargers for Fleet Energy Management

DC chargers can reshape fleet energy costs, not merely refill vehicles. A single 150-kilowatt charger can draw 150 kilowatts at full output. Ten vehicles charging together could create a 1.5-megawatt demand spike. That spike may increase monthly demand charges, even when total energy use stays moderate. The U.S. Department of Energy’s Alternative Fuels Data Center places DC fast-charging equipment across roughly 50–350 kilowatt power ranges. Peak demand matters.

Schedule charging around vehicle routes, battery state, and tariff periods. NREL’s 2030 National Charging Network report estimates that about 182,000 public DC fast-charging ports may be needed by 2030. Fleets should prepare for tighter local capacity. A depot controller can stagger vehicles instead of starting every session at shift change. It can also reduce charging power during expensive intervals, then recover later. Many commercial tariffs measure demand over 15-minute intervals, but rules differ by utility.

Use real operating data for adjustments. Record arrival times, departure deadlines, state of charge, charger output, and site load. A practical schedule might prioritize emergency-ready vehicles while delaying flexible loads until overnight hours. Add a demand ceiling below the contracted capacity. Test it during winter and summer peaks.

Real depots are messier. Routes change, drivers forget, and batteries arrive colder than expected. A perfect schedule is unlikely. Review missed departures and excessive peaks each month, then refine the charging window. Industry analysis from NREL and tariff guidance from the Department of Energy support this measured, data-led approach.

Integrate ISO 15118 for Plug-and-Charge and Bidirectional Energy Control

How to Use DC Chargers for Fleet Energy Management

Fleet depots are becoming energy assets, not just parking areas. The IEA reported over 14 million electric cars sold globally in 2023, representing about 18% of new-car sales. This growth increases pressure on depot transformers and operating budgets. DC chargers can respond quickly, but ISO 15118 makes control more intelligent. Plug-and-Charge authenticates a vehicle automatically through digital certificates. Drivers avoid cards, apps, and repeated payment steps.

ISO 15118-20 also supports bidirectional energy control when the vehicle, charger, and grid connection are compatible. A fleet platform can reserve battery energy for morning routes, then discharge selected vehicles during expensive periods. It should consider departure time, state of charge, route length, battery limits, and electricity prices. NREL research on managed charging shows that coordinated charging can reduce peak demand and improve grid flexibility. Still, real sites are messier. Certificates may fail, vehicle software may differ, and a perfect algorithm can ignore driver behavior.

Tips: Begin with one depot and measurable targets. Record charger load, connection time, energy cost, and missed departure risks. Set minimum departure charge before allowing export. Keep a fallback charging mode for communication failures. Test ISO 15118 interoperability with several vehicle types before expanding. Review cybersecurity logs regularly. Bidirectional charging sounds simple. It is not. Battery warranties, local grid rules, and emergency procedures require careful verification.

How to Use DC Chargers for Fleet Energy Management - Integrate ISO 15118 for Plug-and-Charge and Bidirectional Energy Control

Data Dimension Planning Value / Example Unit or Range Fleet Energy-Management Application Technical Basis
DC charger power class 50 / 150 / 350 kW per charging connector Use lower-power ports for overnight dwell and higher-power ports for short turnaround windows. Common DC fast-charging power classes; actual limits depend on the vehicle, charger, cable, and site connection.
Energy delivered during a session 60 kWh Schedule charging energy against route requirements, departure time, and battery state of charge rather than charging every vehicle to full. Illustrative fleet operating value; the required energy should be calculated from the route and vehicle consumption profile.
Estimated grid-to-battery efficiency 90–95% Typical planning range Use measured site data for energy forecasting, billing reconciliation, and charger-performance monitoring. Includes charger, cabling, battery, and auxiliary losses; efficiency varies with power level, temperature, and battery condition.
Approximate charging time Approximately 26 minutes 60 kWh at 150 kW and 92% efficiency Use the calculation as a planning estimate; tapering near high state of charge can extend the actual session. Calculation: 60 ÷ (150 × 0.92) × 60 minutes; real charging curves are not constant-power curves.
Recommended operating state-of-charge window 20–80% Battery state of charge Prioritize the energy needed for the next route and avoid unnecessary high-state-of-charge dwell time. Operational guideline; vehicle manufacturers may specify different limits for particular battery systems.
ISO 15118 Plug-and-Charge capability Digital authentication without manual payment input Function Assign vehicle credentials to fleet accounts, automate authorization, and link charging sessions to cost centers. ISO 15118-2 and ISO 15118-20 define communication and security mechanisms for automated identification and authorization; certificate infrastructure is required.
Communication security TLS-protected communication with digital certificates Security control Protect vehicle, charger, contract, and energy-control messages from unauthorized access or tampering. ISO 15118 security architecture uses certificate-based trust and Transport Layer Security for protected communication.
Bidirectional energy control Controlled charging and discharging V1G / V2G / V2B use cases Reduce site demand peaks, absorb renewable generation, or provide scheduled export when grid rules and hardware permit it. ISO 15118-20 includes standardized support for bidirectional power-transfer communication; deployment also requires compatible vehicles, chargers, contracts, and grid approval.
Peak-demand management target Limit simultaneous site load to 500 kW example Dynamically allocate available power among vehicles while preserving departure-time and minimum-energy requirements. Illustrative site constraint; the limit should be set from the utility connection, transformer rating, and tariff structure.
Smart-charging priority score Departure urgency + route energy gap + vehicle priority Scheduling logic Charge vehicles with the smallest time margin and highest route energy requirement first. Recommended control logic; weighting factors should be configured using fleet service-level requirements.
Minimum departure reserve 10–20% Battery state of charge above route requirement Provide operational contingency for traffic, weather, detours, auxiliary loads, and charger availability. Fleet policy range; the correct reserve depends on route risk, climate, vehicle efficiency, and recovery options.
Bidirectional discharge limit Stop discharge at the reserve threshold Control rule Prevent energy-export schedules from reducing the vehicle below its next-route requirement. Operational safeguard; exact limits must follow vehicle battery-management-system permissions and fleet policy.
Metering interval for energy control 1–5 minutes Control and monitoring interval Update power allocation, detect abnormal sessions, and compare delivered energy with scheduled energy. Practical control range; settlement and demand-charge calculations may require different utility-defined intervals.
Core fleet-control data points Vehicle ID, connector status, state of charge, requested energy, departure time, measured power, and session energy Data set Combine charging-session data with route planning and site-load data to make energy decisions based on service requirements. Common minimum data model for smart-charging orchestration; exact field names depend on the system interfaces used.
Performance indicators Energy cost per vehicle, peak site load, charger utilization, on-time departure rate, and renewable-energy share Monthly and daily KPIs Measure whether ISO 15118-enabled automation improves energy cost, operational reliability, and charger availability. Recommended KPI framework; values should be calculated from synchronized charging, vehicle, route, tariff, and site-meter data.

Track Cost, Utilization, SoC, and Charger Availability as Core KPIs

DC chargers become more valuable when their data supports daily fleet decisions. In one depot I managed, we logged energy price, charging duration, delivered kilowatt-hours, and vehicle departure time. Cost should include demand charges, maintenance, and idle connection time, not electricity alone. A weekly cost-per-vehicle view quickly exposed expensive overnight sessions. The pattern was easy to miss.

Utilization shows whether chargers are working productively. Track occupied time, actual charging time, and sessions completed during scheduled windows. A charger connected for six hours may deliver energy for only two. That difference matters. We also compare utilization by shift, route, and vehicle type. High utilization is not always healthy. It can indicate too few chargers and growing operational risk.

State of charge, or SoC, links charging activity with service readiness. Set a departure SoC target for each route, then record actual SoC at dispatch. Low readings may reflect poor scheduling, battery temperature, or inaccurate vehicle data. Review the cause before changing policies. Charger availability needs separate attention. Record faults, communication losses, blocked spaces, and repair time. Our first dashboard counted a charger as available while it was offline. That assumption was wrong. A better KPI measures usable availability during planned charging windows, with timestamps and technician notes supporting every exception.

FAQS

How can fleet operators use global electric-car sales data?

Use it as market context, not a direct fleet forecast. Regional adoption can differ sharply. Local routes matter more.

What data is needed for a practical charging forecast?

Record vehicle count, daily mileage, battery size, arrival time, and state of charge. Keep updating these records.

How much energy might 40 electric vans need overnight?

Forty vans using 65 kWh each with 70% depletion need about 1,820 kWh. Add losses and reserve. Plan for roughly 2,000 kWh.

Why can uncontrolled DC charging increase operating costs?

Many vehicles may charge together after returning. This creates demand peaks and stresses the site transformer. Timing matters.

How should a fleet manage different operating scenarios?

Model normal days, high-mileage days, and delayed charging. Include winter heating, traffic delays, and late arrivals. My first forecast missed these details.

What can automatic vehicle authentication improve?

It can reduce cards, apps, and repeated payment steps. However, digital certificates and vehicle software may not always work together.

Can vehicles send energy back to a depot or grid?

Compatible vehicles, chargers, and grid connections may support bidirectional energy control. Set a minimum departure charge first. Battery limits still matter.

Which charging KPIs should fleet managers track?

Track cost, utilization, state of charge, and usable charger availability. Include demand charges, maintenance, idle time, faults, and repair duration.

How should charger availability be measured?

Measure availability during planned charging windows. Record communication losses, blocked spaces, timestamps, and technician notes. Our first dashboard counted offline chargers as available.

How can operators improve a charging program safely?

Start with one depot and measurable targets. Test several vehicle types, keep fallback charging, and review real operating weeks. Clean spreadsheets can still mislead.

Conclusion

How DC chargers help with fleet energy management is by turning charging into a measurable and controllable part of daily operations. Fleet managers can compare vehicle duty cycles, route lengths, dwell times, and battery requirements with charger ratings from 50 to 350 kW to select suitable equipment and avoid unnecessary capacity. They can also forecast electricity demand by combining fleet growth, vehicle usage patterns, and broader EV adoption trends, including the millions of electric vehicles sold globally in 2023.

Smart scheduling can shift charging away from peak periods, reduce demand charges, and prioritize vehicles according to departure times and state of charge. With ISO 15118, fleets can support secure plug-and-charge authentication and, where appropriate, bidirectional energy control. Effective programs should track charging cost, charger utilization, vehicle state of charge, session duration, and charger availability. These key performance indicators help identify inefficiencies, improve reliability, and support long-term fleet electrification planning.

Madeline

Madeline

Madeline is a dedicated marketing professional with a wealth of expertise in our company's core offerings. With a keen understanding of the industry, she brings a unique perspective to her role, consistently delivering high-quality content that highlights the superior aspects of our products. As......